Hi all,
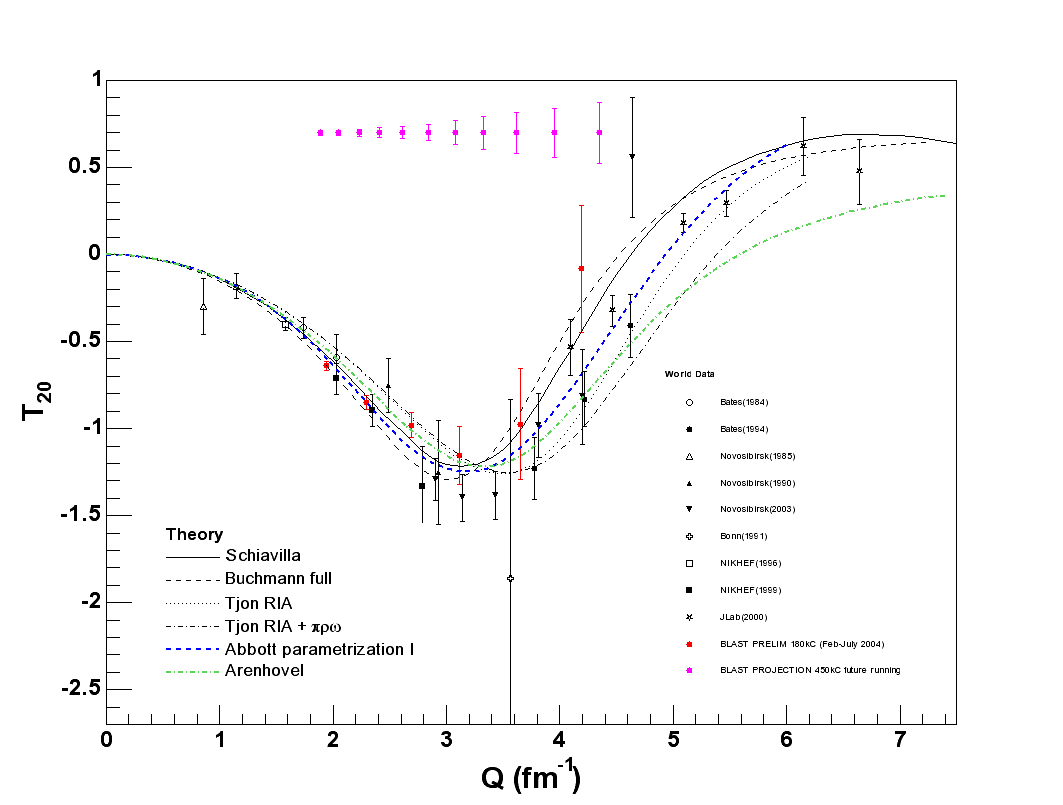
attatched is my latest results in terms of T20 projection. I hope it is
not too late yet. The change is more bins in projection.
in the last couple days, there have been scores of email exchanges
discussing the error propagation, luminosity estimation and T20 projection.
I would like to list my understanding of the current situation:
1. We narrow down the issue to the estimation on luminosity and believe
apart from this issue, Genya, Zilu(proposal) and me are in agreement. It
is my impression that if we adopt a common ground in luminosity, we would
give same results.
2. I realized that my original method to extract T20 is not the most
efficient in terms of using the statistics we gather. By using world data
to fix T21, we reduce the "statistical error" in T21 by a huge amount by
using all world data. Thus we are able to reduce statistical error in
Blast measurement of T20 by almost a factor of 2. The systematic error
introduced in this method is well worth it. I believe it is only
fair to compare results form this new developement to world data.
I implemented both old and new method into my analysis. The old method
seems to provide a very good consistancy check by measuring T20 and T21 at
the same time.
3. I realized that I should be able to adapt binning almost as fine as the
proposal in the projection. It is in fact important to have multiple bins
at the maximum region of T20.
The error bar in each projection point is about three and a half times as
big as the proposal. This is a result of a few factors.
* A factor of 7.5 difficiency in luminosity in data than
proposal(estimated from ed elastic rate)
* a 10% lower tensor polarization,
* a misterously limitted azimuthal acceptance to within +-10 degree
as oppose to +-15 shown in MC. (believe to be bugs in
software, confirmed with Chris, same is seen in ep
elastic)
The minor difference in beam energy used than in proposal, the
disadvantage in running with current spin states probably is made up by
the longer running projected.
I hope the dust is settling down a bit now and I made one new plot. It is
Blast data up to July(180kC running), with projection binned into 11
points. At low Q2 side of the maximum, we are hopeful of making the most
statistically significant measurement so far. At the neighborhood of the
maximum, our statistical errors will compete with the lastest VEPP-3
results in 2003. To the high Q2 end, we are at about same level as Bates
1994 data.
The plot is provided in eps and gif format.
Thanks to every body who provided insights and suggestions which helped me
a lot to gain deepened understanding on my thesis analysis.
I deeply apologize for such a big confusion for such a long period at such
a critical time.
Chi

This archive was generated by hypermail 2.1.2 : Mon Feb 24 2014 - 14:07:31 EST