Hi,
sorry for plague your email boxes.
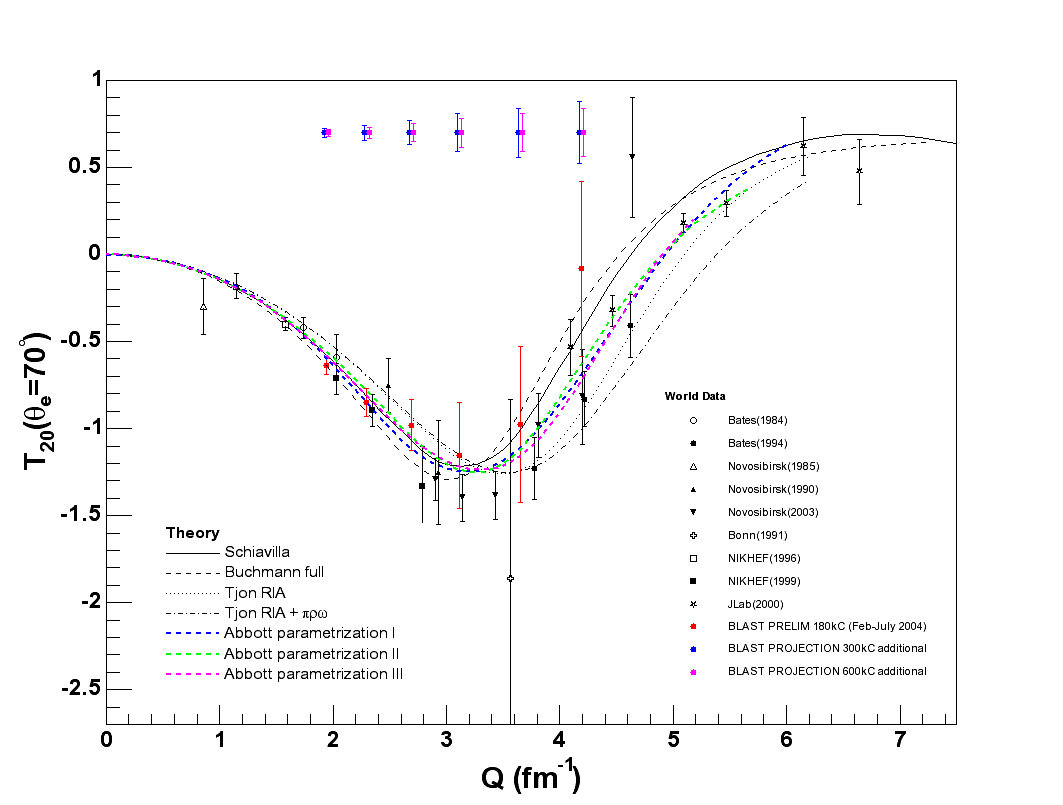
Attatched is a gif file of T20 plots. This time everything on one sheet.
Current data, 300kC projection, 600kC projection, new 2003 VEPP-3 data,
Abbott's three parametrization.
Arenhovel's T20 theory curve is missing. I ll add it as soon as I get the
data.
a few points:
the first three data points at low Q2 are used to fit to Abbott's
parametrization I curve up to 3fm-1, as oppose to use only the first bin.
The first data point and the 3rd are therefore below and above the Abbott
curver within 1-sigma. I understand that one can use the first be alone
for parametrization. Doing that will lift all the data points up by about
7%.
the error size in 600kC projection is about 75% in size of those in 300kC
projection, not exactly 1/sqrt(2) because data taken so far are combined
into the projection already.
Blast error bars are statistical only. error bars in 2003 Novosibirsk data
are quadratic sums of statistics and systematics. For the first 3 of those
points, systematics are about same size of statistics, for the next 3,
their systematics is at 0.05 level.
300kC is the standard projection TB asked for. The advantage of ed elastic
channel is that results from current data are easily factored into the
projection. 600kC is the original projection I did assuming straight
running for 6 months.
Chi

This archive was generated by hypermail 2.1.2 : Mon Feb 24 2014 - 14:07:31 EST