Hi All-
Since I will most likely not make it to the analysis meeting I
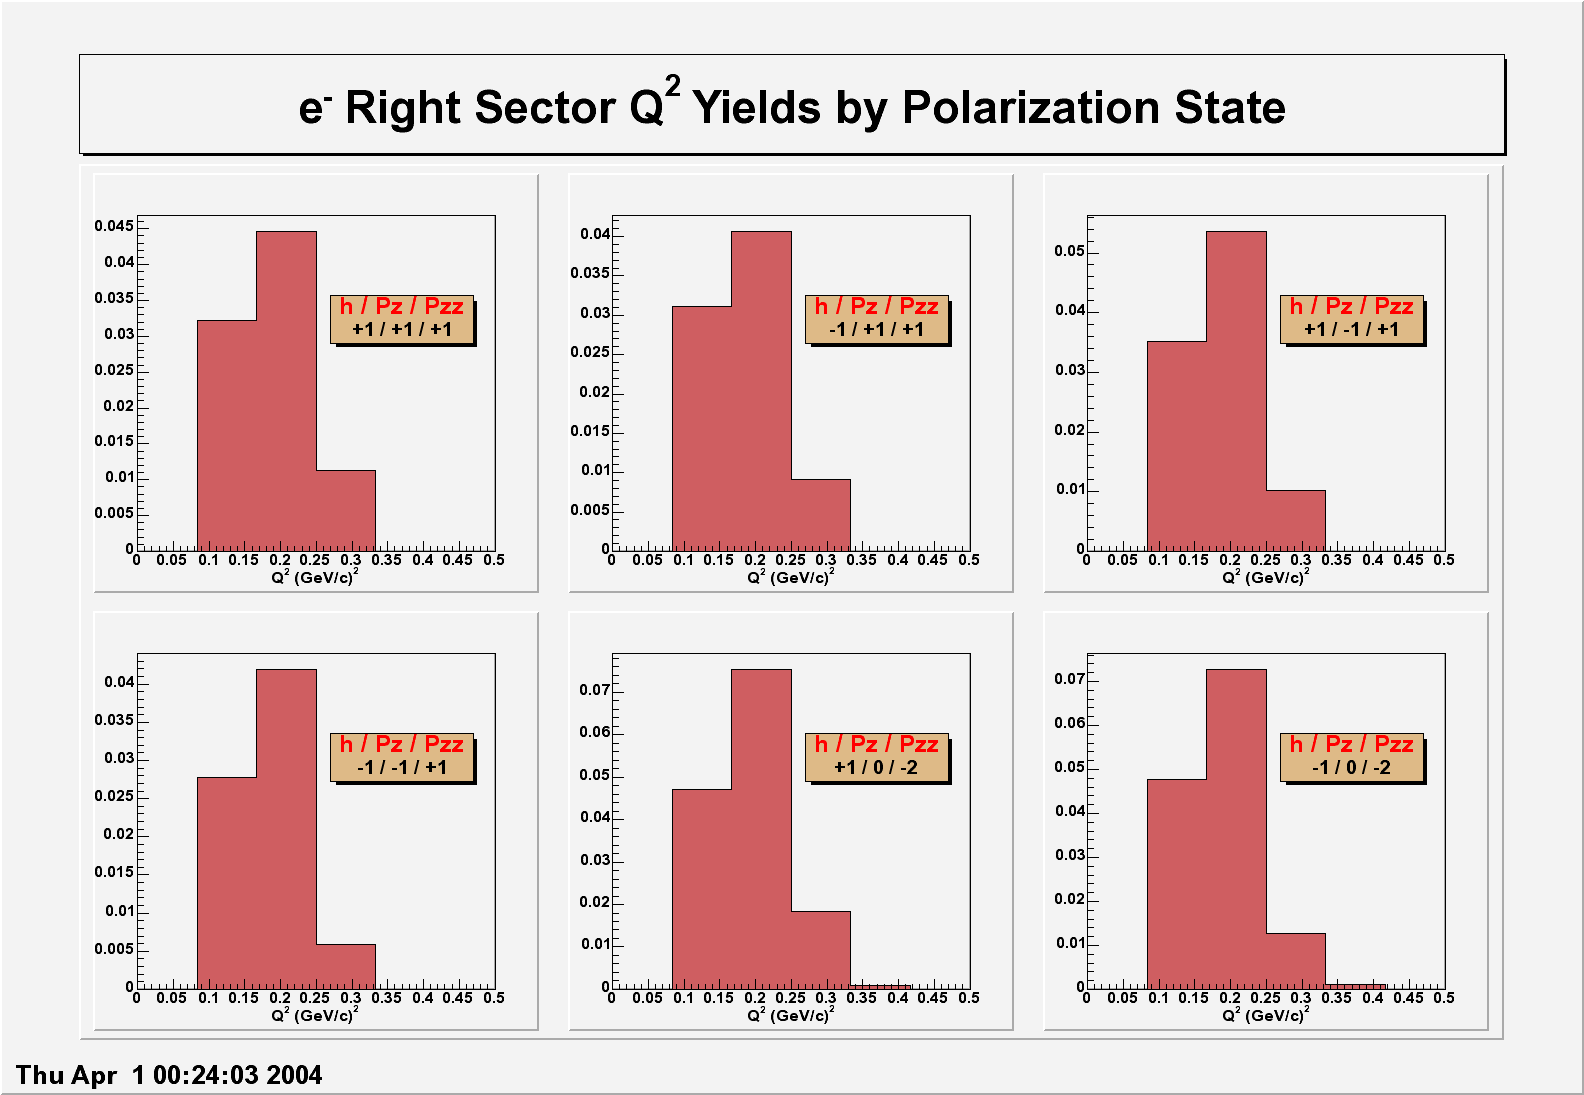
have attached the plots for the latest data (with Karen's new trigger and
45 deg holding field). Please note the following:
1) The theory curve is now based on R10 and R11 with world data for
Gc,Gq, and Gm. (John spoke with Bill Donnelly regarding this last week and
this method was the upshot of that conversation) I am still checking this
though and still need to do a real fit with TMinuit before getting to
dilution factors. (i.e. TGraph is still employed)
2) Attached this time are also Q2 yield plots for each polarization
state.
................................
My near term tasks will be the following:
a) Since DGen has functions for T10 and T11 it is worthwhile to create an
edel theory getter utilising these.
b) Once the theory curve is satisfactory, determine the dilution.
c) Create a dtime-etime plot paddle by paddle to investigate (and maybe
diagnose) this asymmetric deuteron momentum distribution.
Pete
PS Maybe TB will show these plots on my behalf at the meeting. If so,
thanks very much!
----------------------------------------------
Pete Karpius
Graduate Research Assistant
Nuclear Physics Group
University of New Hampshire
phone: (603)862-1220
FAX: (603)862-2998
email: karpiusp@einstein.unh.edu
http://pubpages.unh.edu/~pkarpius/homepage.htm
----------------------------------------------


This archive was generated by hypermail 2.1.2 : Mon Feb 24 2014 - 14:07:30 EST