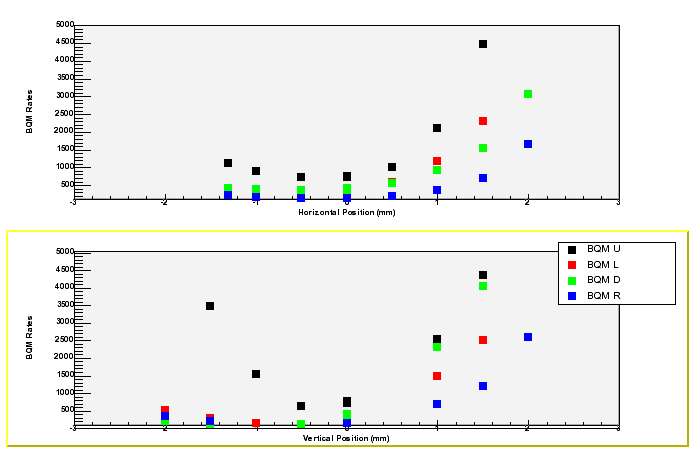
the plot is in elog, but didn't go out with the mail. here it is:
js
Electronic Log Book wrote:
>Operators: seely tong ----
>
>this is not really the shift summary. i just wanted to send out the attached plot and have it go into elog.
>
>the plot shows the BQM rates as a function of beam position for empty target with the slits all the way out. this should be compared to a similar plot tancredi sent out which shows the bqm rates for different positions with the slits optimized for each setting. with the slits out, the BQMs don't all go to a minimum at some beam position, as can be seen in the plot where the BQM rates look flat.
>
>js
>
>
>
>
>
-- -------------------------------------------------------------------- jason seely 26.650.b massachusetts institute of technology 77 massachusetts avenue cambridge, ma 02139-4307email: seely@mit.edu phone: 617.253.4772/6734 html: web.mit.edu/seely/www --------------------------------------------------------------------

This archive was generated by hypermail 2.1.2 : Mon Feb 24 2014 - 14:07:30 EST