hi,
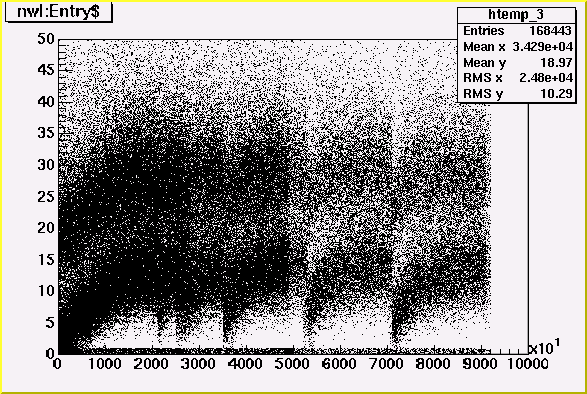
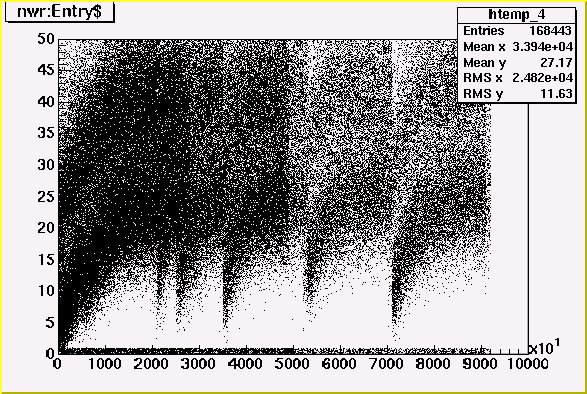
these graphs may be usefull in determining cuts on "nwl,nwr". they
are the number of hits on left/right as a function of time (entry #)
over three runs 3329,30,31. these were hydrogen runs taken in the last
day or so, right inbetween deuterium runs.
doug, does this look consistent with what you would expect?
--chris


This archive was generated by hypermail 2.1.2 : Mon Feb 24 2014 - 14:07:29 EST